Updated: October 5, 2017
Since we first looked at the data, the CDC has published new findings, with new data from 2016 available. It’s only gotten worse, but state rankings have changed. Read on.
With the popularity of hookup apps like Tinder and Grindr, finding casual sex partners has never been easier, but the increasing convenience of enjoying one-nighters has come with a cost: STD rates are surging in the U.S. like never before. Check out the full details and study below.
In alarming news for sexually active singles, CDC reports found that STD rates rose again in 2016, reaching an all-time high by topping 2015 figures, which previously stood as the worst year for STDs in the U.S. The problem is so bad that many experts are labeling the surge in STD rates a national epidemic.
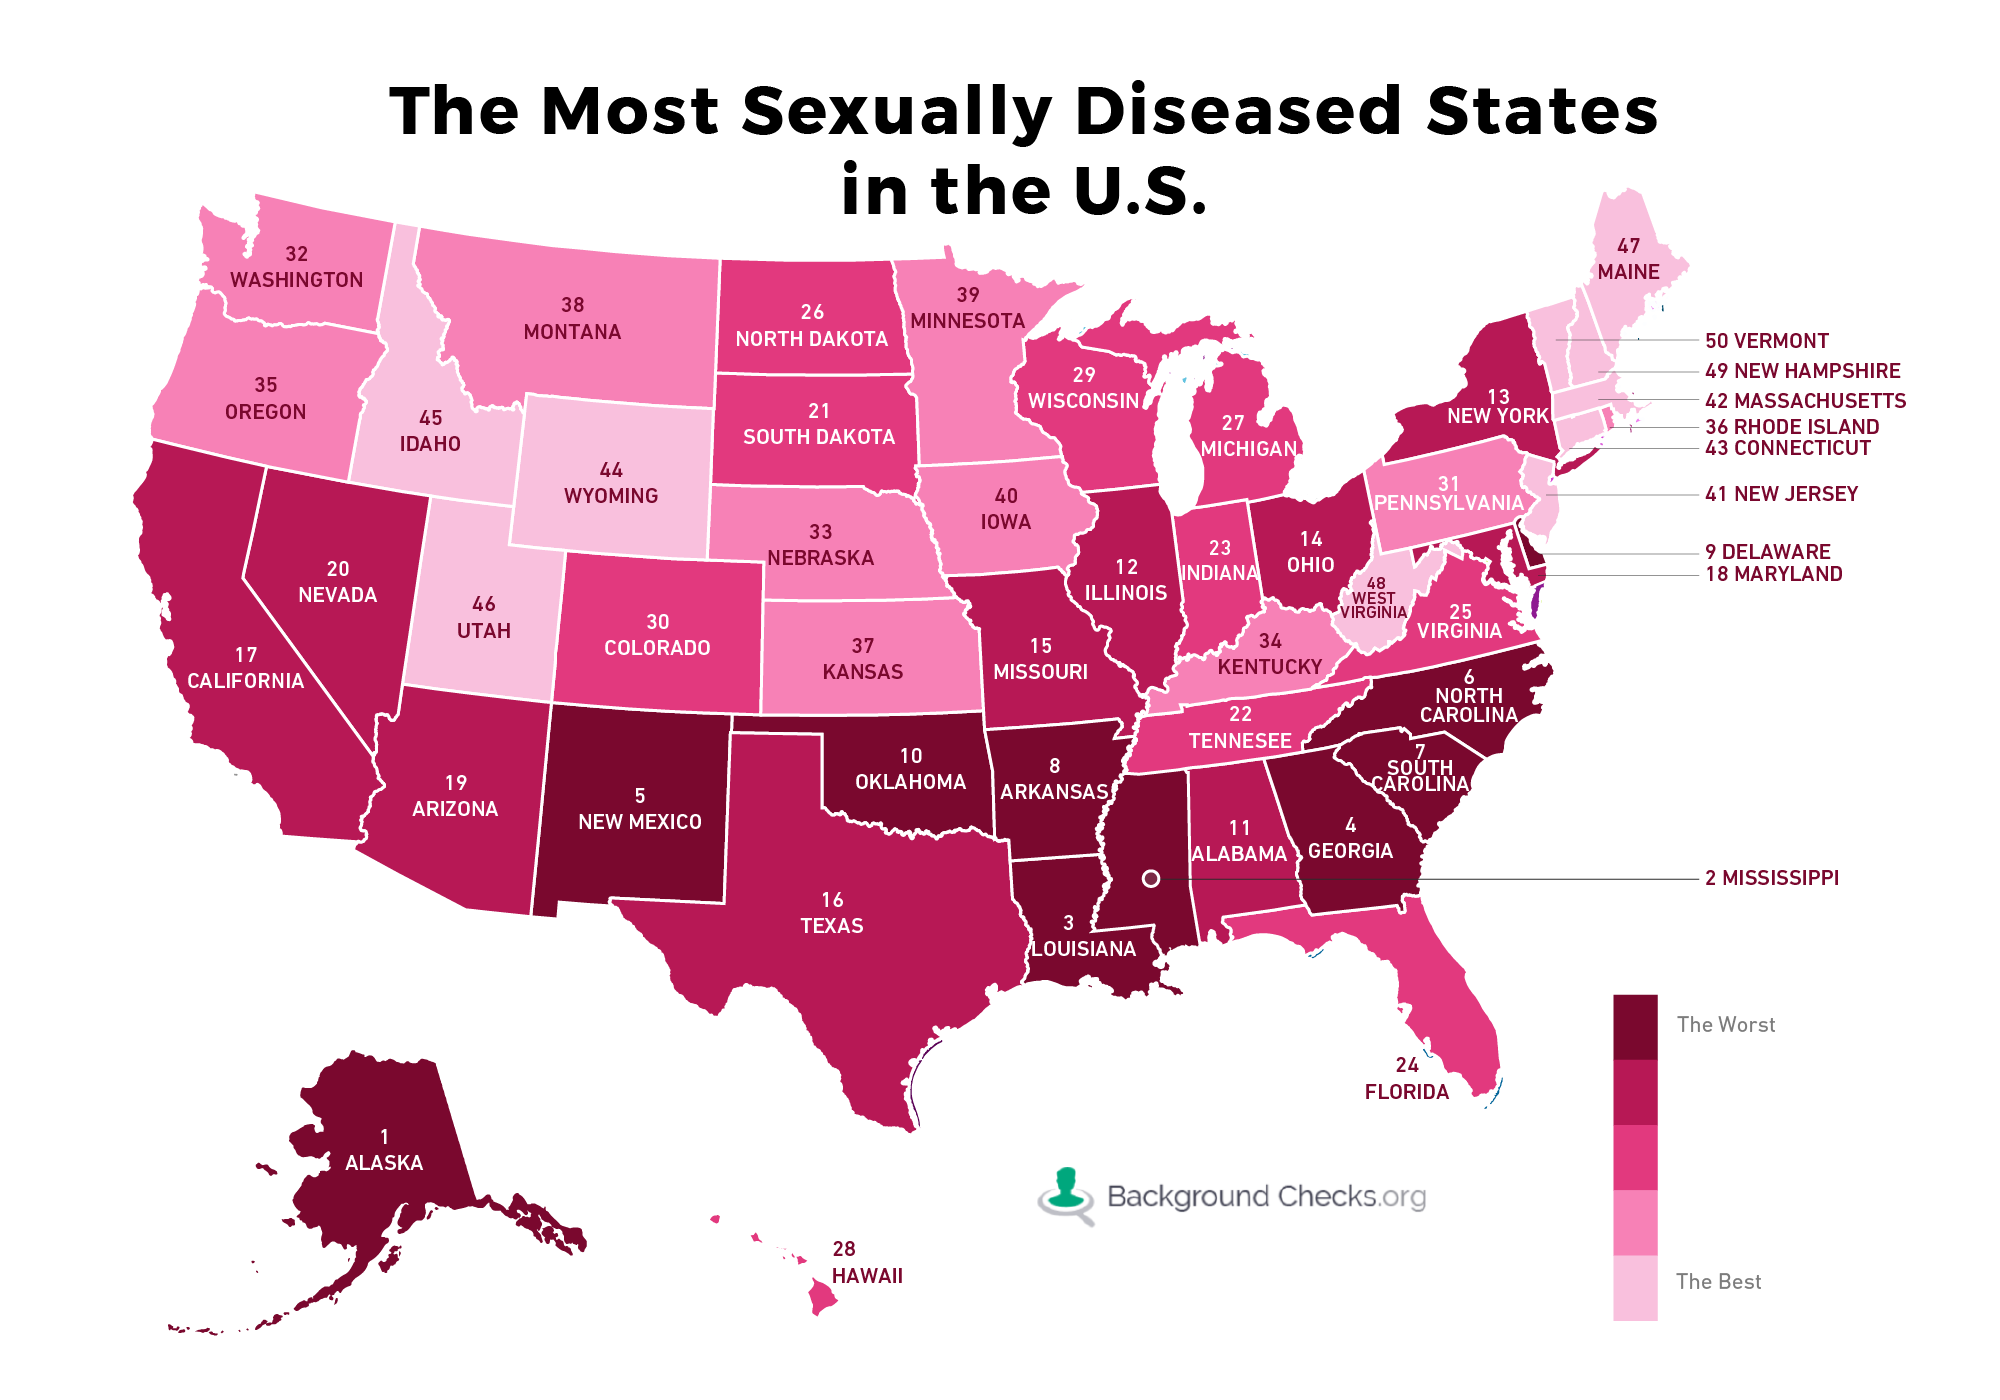
In order to keep you informed about which areas pose the greatest risk, we compiled a nationwide ranking of states by the frequency of STD infection. This report was created by taking local county and state health data, social media surveys, and CDC data on the rate of incidents per 100k residents for the two most common STDs, gonorrhea and chlamydia, and calculating a weighted average between the two. The results may surprise you.
Compared to our earlier 2016 rankings, perhaps the biggest story from the 2016 CDC data is the increase in reported gonorrhea cases. The top ten worst states all experienced a rise in the rate of gonorrhea per 100k residents. In Alaska (#1), Mississippi (#2) and Georgia (#4), the rate rose by more than 40 per 100k, enough for Alaska to maintain its status as the worst state in U.S. for STDs, and for the latter two states to move up several positions in the rankings. The across-the-board increase in gonorrhea infection is startling, and many experts attribute it to the rising prevalence of antibiotic-resistant strains of the disease.
Chlamydia rates also rose in most states, and remains the most common STD in the nation, which is often attributed to the fact that most people infected do not experience symptoms.
Some states were hit hard in 2016: Delaware’s (#9) rate of chlamydia infection increased by over 60 per 100k, enough to bring it into the top ten. Mississippi’s infection rate jumped by a whopping 91.9 per 100k, pushing it up to #2 overall.
Other states fared better, including North Carolina (#7), Louisiana (#2) and New Mexico (#5) which all experienced a decrease in chlamydia infections per 100k.
The state moving up the highest in the rankings is Maryland, jumping up six spots from #24 to #18, owing to significantly elevated rates of both gonorrhea and chlamydia. Next is Delaware, climbing five spots from #14 to #9. There is a four-way tie between Georgia (#4), Indiana (#23), Virginia (#25) and North Dakota (#26) for third greatest increase as they all moved up three places in the rankings.
Hawaii experienced the greatest drop in the rankings, falling eight spots from #20 to #28 due to a decrease in the chlamydia rate per 100k residents. Three states — Texas (#16), Tennessee (#22), and Michigan (#27) — fell four spots each, while three others–North Carolina (#6), Colorado (#30), Vermont (#50) — went down three spots.
Significantly, thirty states either maintained their previous position or only moved one place in the overall rankings.
The Most Sexually Diseased States
| Ranking | State | Chlamydia rate per 100,000 | Gonorrhea rate per 100,000 | Weighted Disease Score | February 2016 Ranking | Change in Ranking |
|---|---|---|---|---|---|---|
| 1 | Alaska | 771.6 | 196.9 | 484.3 | 1 | 0 |
| 2 | Mississippi | 672.1 | 239.2 | 455.7 | 4 | 2 |
| 3 | Louisiana | 679.3 | 230.8 | 455.1 | 2 | -1 |
| 4 | Georgia | 614.6 | 201.2 | 407.9 | 7 | 3 |
| 5 | New Mexico | 628.6 | 168.6 | 398.6 | 5 | 0 |
| 6 | North Carolina | 577.6 | 196 | 386.8 | 3 | -3 |
| 7 | South Carolina | 575.5 | 187.8 | 381.7 | 6 | -1 |
| 8 | Arkansas | 562 | 192.5 | 377.3 | 9 | 1 |
| 9 | Delaware | 567.2 | 179.9 | 373.6 | 14 | 5 |
| 10 | Oklahoma | 548.4 | 193.6 | 371.0 | 8 | -2 |
| 11 | Alabama | 553.6 | 173 | 363.3 | 10 | -1 |
| 12 | Illinois | 561.4 | 164.8 | 363.1 | 11 | -1 |
| 13 | New York | 552.8 | 146.5 | 349.7 | 13 | 0 |
| 14 | Ohio | 520.9 | 176.4 | 348.7 | 15 | 1 |
| 15 | Missouri | 507 | 188.7 | 347.9 | 17 | 2 |
| 16 | Texas | 520.4 | 154.6 | 337.5 | 12 | -4 |
| 17 | California | 506.2 | 164.9 | 335.6 | 16 | -1 |
| 18 | Maryland | 510.4 | 158.5 | 334.5 | 24 | 6 |
| 19 | Arizona | 511.5 | 151.3 | 331.4 | 19 | 0 |
| 20 | Nevada | 506.7 | 151.5 | 329.1 | 22 | 2 |
| 21 | South Dakota | 504.5 | 147.8 | 326.2 | 21 | 0 |
| 22 | Tennessee | 489.4 | 154.2 | 321.8 | 18 | -4 |
| 23 | Indiana | 466 | 142.8 | 304.4 | 26 | 3 |
| 24 | Florida | 467.4 | 138.9 | 303.2 | 25 | 1 |
| 25 | Virginia | 473.2 | 132.2 | 302.7 | 28 | 3 |
| 26 | North Dakota | 456.5 | 132.1 | 294.3 | 29 | 3 |
| 27 | Michigan | 462.9 | 125.5 | 294.2 | 23 | -4 |
| 28 | Hawaii | 482.1 | 102.5 | 292.3 | 20 | -8 |
| 29 | Wisconsin | 466 | 112.6 | 289.3 | 31 | 2 |
| 30 | Colorado | 468.6 | 109.5 | 289.1 | 27 | -3 |
| 31 | Pennsylvania | 444.7 | 114.1 | 279.4 | 30 | -1 |
| 32 | Washington | 435.9 | 114 | 275.0 | 33 | 1 |
| 33 | Nebraska | 432.3 | 113.7 | 273.0 | 32 | -1 |
| 34 | Kentucky | 413.2 | 131.3 | 272.3 | 35 | 1 |
| 35 | Oregon | 432.5 | 108 | 270.3 | 36 | 1 |
| 36 | Rhode Island | 467.3 | 67.8 | 267.6 | 34 | -2 |
| 37 | Kansas | 417.6 | 115.2 | 266.4 | 38 | 1 |
| 38 | Montana | 427.5 | 83.9 | 255.7 | 37 | -1 |
| 39 | Minnesota | 413.2 | 93 | 253.1 | 39 | 0 |
| 40 | Iowa | 415.6 | 83.2 | 249.4 | 40 | 0 |
| 41 | New Jersey | 385.3 | 91.1 | 238.2 | 41 | 0 |
| 42 | Massachusetts | 394.5 | 73.3 | 233.9 | 43 | 1 |
| 43 | Connecticut | 387.4 | 76.1 | 231.8 | 42 | -1 |
| 44 | Wyoming | 351.5 | 46.9 | 199.2 | 44 | 0 |
| 45 | Idaho | 356.3 | 38.4 | 197.4 | 45 | 0 |
| 46 | Utah | 315.7 | 70.1 | 192.9 | 46 | 0 |
| 47 | Maine | 312.6 | 33.9 | 173.3 | 48 | 1 |
| 48 | West Virginia | 261.4 | 49.8 | 155.6 | 49 | 1 |
| 49 | New Hampshire | 260.6 | 34.3 | 147.5 | 50 | 1 |
| 50 | Vermont | 269.9 | 20.1 | 145.0 | 47 | -3 |
