Archive

Category Archives for "Rankings"

Cities with the Most Credit Card Fraud

It’s the holiday shopping season, which means it’s a vulnerable time of year for consumers to fall prey to credit card fraud.  

Not only is credit card fraud the most common type of identity theft in 2023, but it’s also more frequent than ever, according to the Federal Trade Commission. In fact, reports of credit card fraud surged by 62% from 2019 (pre-pandemic) to 2022. 

Through the first three quarters of 2023, credit card fraud reports are still above pre-pandemic levels, with 318,142 credit card fraud complaints reported so far this year. 

But where is credit card fraud the most common? 

We analyzed credit card fraud complaint data from the FTC in order to determine which cities and states are the most prone to fraud. Our analysis includes the credit card fraud complaint data from 2023 across the most populated metropolitan areas nationwide.

Key findings

  • Florida is home to the most credit card fraud in the nation, with 170.8 reports per 100,000 residents. Three Florida metro areas—Miami (No. 1), Orlando (No. 5) and Tampa (No. 10)—all rank within the top 10 metros with the most card fraud. 
  • Atlanta (No. 2), Los Angeles (No. 3), and Las Vegas (No. 4) round out the top five metro cities with the most credit card fraud. 
  • From 2019 (pre-pandemic) to 2022, credit card fraud skyrocketed by 62%.
  • Nationwide, 318,142 credit card fraud complaints have been reported in 2023. 
  • 30–39-year-olds are the most likely age group to be victims of credit card fraud.

Which cities have the most credit card fraud?

Credit card fraud is defined as the misuse of a consumer's identity to open a fraudulent credit card account or to make unauthorized charges to an existing credit card account. 

According to FTC data, Florida is the credit card fraud capital of the U.S. In 2023, consumers in Florida reported a staggering 37,999 instances of credit card fraud. Three Florida metro cities in particular rank among the highest cities in the nation for credit card fraud. The Miami metropolitan area ranks No. 1 for credit card fraud, with more than 20,000 fraud complaints being reported in 2023. 

Elsewhere, the Orlando metro area ranks 5th, and the Tampa-St. Petersburg metro area ranks 10th in the nation for card fraud. Both Orlando and Tampa have each reported more than 4,000 fraud complaints this year. 

Texas is also home to two cities within the top 10 ranking, including Houston (No. 7) and Dallas (No. 8). Statewide, Texas reported 31,591 instances of credit card fraud, which makes it the 7th highest ranked state in the nation for fraud, according to the FTC. 

In terms of other metro cities that are prone to credit card fraud, Atlanta ranks 2nd in the nation with 211.4 credit card fraud reports per 100,000. Los Angeles ranks 3rd with 206.9 per 100,000, followed by Las Vegas (174.5 per 100,000). 

Top five cities with the most credit card fraud

#1 Miami–Port St. Lucie–Fort Lauderdale, FL 

  • 2023 credit card fraud reports: 20,386
  • 2023 credit card fraud reports per 100K: 332.1

#2 Atlanta–Athens-Clarke County–Sandy Springs, GA-AL

  • 2023 credit card fraud reports: 13,186
  • 2023 credit card fraud reports per 100K: 211.4

#3 Los Angeles–Long Beach, CA 

  • 2023 credit card fraud reports: 26,638
  • 2023 credit card fraud reports per 100K: 206.9

#4 Las Vegas–Henderson, NV

  • 2023 credit card fraud reports: 4,053
  • 2023 credit card fraud reports per 100K: 174.5

#5 Orlando–Lakeland–Deltona, FL

  • 2023 credit card fraud reports: 4,728
  • 2023 credit card fraud reports per 100K: 171.0

Where credit card fraud is on the rise

Not only has credit card fraud skyrocketed since the pandemic, but in several cities, fraud has also seen a year-over-year increase. Topping the list of cities that have experienced the largest year-over-year increase in card fraud is Hartford, Connecticut. According to the FTC, fraud is up by one-quarter (25.5%) in Hartford compared to 2022. 

Elsewhere, Detroit has seen a 19% year-over-year increase. Fraud is also up by 18.6% in Columbus, Ohio and about 16% in both San Francisco, California as well as Boston, Massachusetts. 

Credit card fraud by age

Credit card fraud can happen to any consumer, regardless of their age, but older millennials between the ages of 30-39 are the most likely to fall victim to credit card fraud. 

According to the FTC, millennials between 30-39 years old make up nearly one-third of credit card fraud victims. In 2022, 121,654 millennials aged 30-39 were victims of credit card fraud. 

States with the most credit card fraud 

Along with analyzing credit card fraud in metro cities, we also looked at fraud on the statewide level. Florida tops the list with 170.8 complaints per 100,000. Total losses for all types of fraud including credit card fraud and other forms of identity theft in the Sunshine State total $451.8 million in 2023.

Head north of Florida to find the state with the 2nd most credit card fraud complaints. Georgia reported 153.2 complaints per 100,000, which is more than 16,000.   

Despite being one of the least populated states in the country, Delaware ranks 4th in the nation for credit card fraud reports per 100,000. In 2023, Delaware reported 125.4 credit card fraud instances per 100,000. 

Although credit card fraud is the most common type of fraud, there are several steps you can take to avoid falling victim. The FTC recommends that consumers check their credit reports frequently as well as review bank and credit card statements to keep an eye out for unauthorized transactions or suspicious activity. 

It’s also recommended to avoid using public wi-fi when conducting financial transactions. Consumers should also set up a strong password. The FTC also warns against providing credit card details over the phone unless you have initiated the phone call. 

Running a background check on yourself can also reveal signs of identity theft. If you have been a victim of credit card fraud, notify your bank and place a fraud alert on your credit reports.  

You can also report credit card fraud to the FTC, which can help future fraud from occurring and bring cases against scams as well as bad business practices. 

Methodology

To establish our ranking, we conducted an analysis of credit card fraud complaints in the 50 most populated metropolitan statistical areas in the country, as well as all 50 states, utilizing data from the Federal Trade Commission’s Consumer Sentinel Network. The ranking of metropolitan areas and states was determined based on the incidence of credit card fraud reports per 100,000 residents. This analysis encompassed historical data spanning from 2018 to 2022, as well as the most recent available data from the first three quarters of 2023. The definition of metropolitan areas adheres to the criteria set forth by the Office of Management and Budget.

Sources: Federal Trade Commission Consumer Sentinel Network, U.S. Census Bureau. 

Fair Use: Feel free to use this data and research with proper attribution linking to this study.

Media Inquiries: For media inquiries, contact media@thisisnoble.co

Which States Have the Most STDs? (2024)


Whether you’re just starting a relationship with a new partner or haven’t been tested recently for sexually transmitted diseases (STDs), it’s always important to be vigilant about your sexual health.

STD rates continue to increase year-over-year, according to the Centers for Disease Control and Prevention (CDC). In fact, even the pandemic didn’t prevent STD rates from increasing across the country. According to the CDC, both gonorrhea and syphilis cases increased during the first year of the pandemic by 10% and 7%, respectively.

But if you have an active sex life, there are several ways to keep you and your partner safe. Along with testing, understanding your risk environment can also play a role in your sexual health. And while no state is immune to STDs, some areas are more prone to higher rates of STDs than others. 

We recently broke down the data to analyze which states have the most STDs as well as the states that have been experiencing the largest increase in STDs since 2015.

Our analysis took a look at the most recent data available via the CDC’s Sexually Transmitted Disease Surveillance and included cases for gonorrhea, chlamydia, HIV as well as primary & secondary (P&S) syphilis.  

Data reveals STD rates by State

#1 Mississippi

No state in the nation has more STDs per 100,000 residents than Mississippi. Overall, the CDC data estimates that the state has 48,548 total cases, which is 1,958 per 100,000. STDs within the analysis include gonorrhea, chlamydia, HIV as well as primary & secondary (P&S) syphilis.

Not only is Mississippi home to the most STD cases in the country, but cases continue to climb every year. The state has seen an average annual increase of 8.32% in STDs since 2015, according to the CDC. On average, Mississippi records 41,488 STD cases every year.

#2 Louisiana

Mississippi’s neighbor to the west, Louisiana, comes in at No. 2 for states with the most STDs. According to CDC data, Louisiana has 1,846 STDs per 100,000, which is about 71,286 total cases. Like Mississippi, STDs continue to rise in Louisiana, but at a lower rate. Overall, the state records an average of 68,269 cases annually and Louisiana has seen an average annual increase of 2.41% in STDs since 2015.

#3 Georgia

We remain in the South to find the third state in our analysis, which is Georgia. Overall, Georgia has 1,657 STDs per 100,000 (147,340 total cases). The state has also seen a 3.16% average annual increase in STDs since 2015 and records an average of 141,805 STD cases annually. 

#4 New York

New York is the only state within the top five on our list that is not located in the South. The state has 1,639 STDs per 100,000 residents, which is about 270,607 total cases, according to the CDC. It’s also seen an average annual increase of 1.14% and records an average of 276,429 STD cases per year. 

#5 South Carolina

Rounding out the top five on our list of states with the most STDs is South Carolina. The Palmetto State has 1,599 STDs per 100,000 residents, which is about 70,044 total cases, according to the CDC. South Carolina also ranks fifth for states with the highest average annual increase in STD cases. Overall, the state records an average of 62,198 cases per year and cases have been increasing 6.14% on average every year since 2015. 

Where have STDs increased the most?

Along with analyzing STD cases by state, we also looked at historical data to determine which states have seen the largest increase in cases each year since 2015.

STD rates continue to climb nationwide. Preliminary data for 2021 shows a 4.4% increase nationwide in chlamydia, gonorrhea and syphilis cases (2,391,609 in 2020 versus 2,496,235 in 2021), according to the CDC. 

When analyzing data to determine which states have seen the largest annual increases in STDs since 2015, Iowa ranks No. 1 followed by Mississippi at No. 2 and Kansas at No. 3.

How to prevent STDS

Even though there isn’t a risk-free state when it comes to STDs, there are several steps you can take in order to prevent STDs, including testing, which the CDC recommends being done once a year for syphilis, chlamydia, and gonorrhea. Also, all adults and adolescents from ages 13 to 64 should be tested at least once for HIV.

Those who are pregnant should be tested early in pregnancy for syphilis, HIV, hepatitis B, and hepatitis C. Those with multiple or anonymous partners should be tested more frequently (e.g., every 3 to 6 months), according to the CDC.

Overall, abstinence is the most effective way to prevent STDs, but reducing your number of sexual partners, mutual monogamy and using a condom are also ways that can help reduce your risk of contracting a sexually transmitted disease. 

Methodology

To determine our ranking, we analyzed data for sexually transmitted diseases within all 50 states for 2015, 2016, 2017, 2018, 2019 and 2020, which is the most recent data available via Centers for Disease Control and Prevention. STD cases within the analysis include HIV prevalence, HIV diagnoses, primary & secondary (P&S) syphilis, chlamydia and gonorrhea. 

Sources: U.S. Census Bureau, Centers for Disease Control and Prevention (CDC).    

Fair Use: Feel free to use this data and research with proper attribution linking to this study.

Media Inquiries: For media inquiries, contact media@thisisnoble.co

Cities with the Most Female Business Owners

Photo Credit: JKstock / Shutterstock

Small businesses are a major engine of growth in the U.S. economy, and women are playing an increasingly large role in the country’s entrepreneurial ecosystem. According to recent data from the U.S. Census Bureau, women-owned firms now represent more than one in five businesses with employees in the U.S., a figure that has trended upward in recent years. These enterprises  report over $1.8 trillion in annual revenue and employ nearly 11 million workers.

While women-owned businesses are becoming a more significant part of the economy, the Census Bureau’s data also shows that women’s experiences of entrepreneurship frequently look different than men’s. Notably, the industries that women tend to start businesses in are different from the most common industries for men. In particular, fields like health care and social assistance or accommodation and food service tend to have higher proportions of women-owned businesses. And in part due to these differences in industry, women-owned firms tend to pay less per employee (-30.1%) than the national average.

However, these differences also extend to women’s reasons for getting into business in the first place. Women are more likely than men to report that flexible hours or balancing work and family obligations were very important when deciding to start a business. Meanwhile, men are more likely to say that the possibility of earning greater income or wanting to be their own boss motivated their decision to start a business.

It is most common for both female and male business owners to still be with their first business, but more female business owners (55%) are involved with their first business than their male counterparts (47.5%). In contrast, men are more likely to have moved on from a previous business in some form. Men more frequently respond that they still operate a previous business, that their business was sold to another company or individual, or that a previous business is no longer in operation.

Women-owned businesses are also distributed unevenly across the U.S. Hawaii stands out as having the highest share of women-owned businesses at 24.5%, with Virginia (23.9%) and Colorado (23.8%) not far behind. At the other end of the spectrum, many of the states with the lowest share of female-owned businesses are found in the central U.S., including South Dakota (13.6%), North Dakota (14.2%), and Iowa (15.9%). At the metro level, many of the top states are well-represented, with locations like Honolulu, Denver, and the Washington, D.C. metro having especially high concentrations of female enterprises.


LEARN MORE

Learn what public records are and how to get access to most of the information for free or for a low cost in our detailed guide on understanding public records. Then use our public records search tool to find what you’re looking for.


The data used in this analysis is from the U.S. Census Bureau’s Annual Business Survey. To determine the locations with most female business owners, researchers at backgroundchecks.org calculated the percentage of businesses that are women-owned.

In the event of a tie, the location with a greater total number of businesses that are women-owned was ranked higher. Only the 100 largest metropolitan areas for which complete data was available were considered in this analysis. All data shown represents employer firms only (i.e., businesses with employees); firms without employees are not included.

Here are the U.S. metros with the most female business owners.

Major U.S. Metros With Most Female Business Owners

Photo Credit: Sean Pavone / Shutterstock

15. Baltimore-Columbia-Towson, MD

  • Percentage of businesses that are women-owned: 22.3%
  • Total businesses that are women-owned: 11,456
  • Total employment at women-owned businesses: 110,780
  • Total revenue at women-owned businesses: $5 billion or more

DID YOU KNOW?

A reverse address lookup is the act of finding information about the current residents, former residents, or property owner of a home or business using a specific street address. 


Photo Credit: Sean Pavone / Shutterstock

14. Las Vegas-Henderson-Paradise, NV

  • Percentage of businesses that are women-owned: 22.4%
  • Total businesses that are women-owned: 8,375
  • Total employment at women-owned businesses: 70,423
  • Total revenue at women-owned businesses: $5 billion or more

Photo Credit: Sean Pavone / Shutterstock

13. San Francisco-Oakland-Berkeley, CA

  • Percentage of businesses that are women-owned: 22.5%
  • Total businesses that are women-owned: 23,777
  • Total employment at women-owned businesses: 177,572
  • Total revenue at women-owned businesses: $5 billion or more

Photo Credit: Sean Pavone / Shutterstock

12. Houston-The Woodlands-Sugar Land, TX

  • Percentage of businesses that are women-owned: 22.7%
  • Total businesses that are women-owned: 25,167
  • Total employment at women-owned businesses: 238,105
  • Total revenue at women-owned businesses: $5 billion or more

Photo Credit: Sean Pavone / Shutterstock

11. Atlanta-Sandy Springs-Alpharetta, GA

  • Percentage of businesses that are women-owned: 22.8%
  • Total businesses that are women-owned: 25,815
  • Total employment at women-owned businesses: 196,911
  • Total revenue at women-owned businesses: $5 billion or more

Photo Credit: Sean Pavone / Shutterstock

10. Richmond, VA

  • Percentage of businesses that are women-owned: 23.0%
  • Total businesses that are women-owned: 5,898
  • Total employment at women-owned businesses: 46,459
  • Total revenue at women-owned businesses: $5 billion or more

Photo Credit: Sean Pavone / Shutterstock

9. Jacksonville, FL

  • Percentage of businesses that are women-owned: 23.0%
  • Total businesses that are women-owned: 6,805
  • Total employment at women-owned businesses: 50,424
  • Total revenue at women-owned businesses: $5 billion or more

Photo Credit: Sean Pavone / Shutterstock

8. Miami-Fort Lauderdale-Pompano Beach, FL

  • Percentage of businesses that are women-owned: 23.0%
  • Total businesses that are women-owned: 39,597
  • Total employment at women-owned businesses: 213,294
  • Total revenue at women-owned businesses: $5 billion or more

Photo Credit: Sean Pavone / Shutterstock

7. Durham-Chapel Hill, NC

  • Percentage of businesses that are women-owned: 23.4%
  • Total businesses that are women-owned: 2,458
  • Total employment at women-owned businesses: 14,403
  • Total revenue at women-owned businesses: $1 billion to less than $5 billion

Photo Credit: Sean Pavone / Shutterstock

6. New Orleans-Metairie, LA

  • Percentage of businesses that are women-owned: 23.7%
  • Total businesses that are women-owned: 5,808
  • Total employment at women-owned businesses: 72,267
  • Total revenue at women-owned businesses: $5 billion or more

Photo Credit: Alexandr Junek Imaging / Shutterstock

5. Virginia Beach-Norfolk-Newport News, VA-NC

  • Percentage of businesses that are women-owned: 23.7%
  • Total businesses that are women-owned: 6,336
  • Total employment at women-owned businesses: 47,970
  • Total revenue at women-owned businesses: $5 billion or more

Photo Credit: turtix / Shutterstock

4. Albuquerque, NM

  • Percentage of businesses that are women-owned: 23.8%
  • Total businesses that are women-owned: 3,583
  • Total employment at women-owned businesses: 29,324
  • Total revenue at women-owned businesses: $1 billion to less than $5 billion

Photo Credit: Sean Pavone / Shutterstock

3. Washington-Arlington-Alexandria, DC-VA-MD-WV

  • Percentage of businesses that are women-owned: 24.0%
  • Total businesses that are women-owned: 26,857
  • Total employment at women-owned businesses: 255,460
  • Total revenue at women-owned businesses: $5 billion or more


GIVE IT A TRY

Find out who’s behind any phone number, and learn exactly how reverse phone number lookups work, in our comprehensive reverse phone lookup guide. 


Photo Credit: Sean Pavone / Shutterstock

2. Denver-Aurora-Lakewood, CO

  • Percentage of businesses that are women-owned: 24.4%
  • Total businesses that are women-owned: 17,045
  • Total employment at women-owned businesses: 131,685
  • Total revenue at women-owned businesses: $5 billion or more

Photo Credit: Dave H. Fine / Shutterstock

1. Urban Honolulu, HI

  • Percentage of businesses that are women-owned: 26.1%
  • Total businesses that are women-owned: 4,304
  • Total employment at women-owned businesses: 44,130
  • Total revenue at women-owned businesses: $5 billion or more

Detailed Findings & Methodology

The data used in this analysis is from the U.S. Census Bureau’s Annual Business Survey. To determine the locations with most female business owners, researchers calculated the percentage of businesses that are women-owned. In the event of a tie, the location with a greater total businesses that are women-owned was ranked higher. Only the 100 largest metropolitan areas for which complete data was available were considered in this analysis. All data shown represents employer firms only; firms without employees are not included.

Cities With the Largest Immigrant Populations

Photo Credit: spyarm / Shutterstock

With a foreign-born population of more than 44 million, the U.S. has the largest number of immigrants in the world. In fact, research from the Pew Research Center shows that the U.S. immigrant population accounts for one-fifth of the world’s migrants. While U.S. immigrants come from almost every country in the world, Mexico is the most common country of origin for the foreign-born population.

From the period of 1850 to 2020, when the most recent data is available, the foreign-born population share hit a high of 14.8% in 1900. From 1920 to 1980, the share of immigrants fell, dropping to a low of 4.7% in 1980. Until recently, the immigrant share of the population had been climbing and was at a near historic high in 2019 before the pandemic. The share of immigrants dropped slightly in 2020 to 13.5%, down from the 13.7% it had stood at for the last several years.

Accounting for 24.8% of the foreign-born population, Mexico claims the largest number of U.S. immigrants. The Chinese and Indian immigrant populations are also large, making up a collective 12.2% of the foreign-born population. Pew Research Center analysis of Census Bureau data shows that about one million immigrants arrive in the U.S. each year, and the most common region for new immigrants is now Asia, which recently surpassed Hispanic countries.


DID YOU KNOW?

In the past 50 years, legislation passed on the state and federal level has clarified the public’s right to access records held by government bodies without the need of a statement of intent, while placing restrictions on an agency’s right to deny access to records. Learn how to get access to most of the information for free or for a low cost with our public records search tool.


While immigrants live in every U.S. state, some parts of the country have larger foreign-born populations than others. Over one-fourth of California’s population is foreign-born—mostly coming from Mexico—making California the top state for immigrants. New Jersey and New York also have large immigrant populations, with 22.7% and 22.4% of their populations being immigrants, respectively. Alternatively, Montana and West Virginia have very small immigrant populations, accounting for just 2.2% and 1.6% of their populations, respectively.

To determine the U.S. metropolitan areas with the largest immigrant populations, researchers at backgroundchecks.org analyzed the latest data from the U.S. Census Bureau. The researchers ranked metros according to the foreign-born population share. Researchers also calculated the most common country of origin, the total foreign-born population, and the total population.

To improve relevance, only metropolitan areas with at least 100,000 people were included in the analysis. Additionally, metro areas were grouped into the following cohorts based on population size: 

  • Small metros: 100,000–349,999
  • Midsize metros: 350,000–999,999
  • Large metros: more than 1,000,000

Here are the metros with the largest immigrant populations.

Large Metros With the Most Immigrants

Photo Credit: Andriy Blokhin / Shutterstock

15. Sacramento-Roseville-Folsom, CA

  • Foreign-born population share: 18.5%
  • Most common country of origin: Mexico
  • Total foreign-born population: 432,837
  • Total population: 2,338,866

TRENDING

Curious how a reverse phone lookup works? Find out in our detailed guide, and give our free reverse phone lookup tool a try.


Photo Credit: f11photo / Shutterstock

14. Dallas-Fort Worth-Arlington, TX

  • Foreign-born population share: 18.5%
  • Most common country of origin: Mexico
  • Total foreign-born population: 1,376,117
  • Total population: 7,451,858

Photo Credit: Songquan Deng / Shutterstock

13. Orlando-Kissimmee-Sanford, FL

  • Foreign-born population share: 18.8%
  • Most common country of origin: Colombia
  • Total foreign-born population: 481,158
  • Total population: 2,560,260

Photo Credit: Travellaggio / Shutterstock

12. Boston-Cambridge-Newton, MA-NH

  • Foreign-born population share: 18.9%
  • Most common country of origin: China
  • Total foreign-born population: 918,197
  • Total population: 4,854,808

Photo Credit: mahaloshine / Shutterstock

11. Seattle-Tacoma-Bellevue, WA

  • Foreign-born population share: 19.2%
  • Most common country of origin: Mexico
  • Total foreign-born population: 754,455
  • Total population: 3,928,498

Photo Credit: Jon Bilous / Shutterstock

10. Riverside-San Bernardino-Ontario, CA

  • Foreign-born population share: 21.1%
  • Most common country of origin: Mexico
  • Total foreign-born population: 970,476
  • Total population: 4,600,396

Photo Credit: Virrage Images / Shutterstock

9. Las Vegas-Henderson-Paradise, NV

  • Foreign-born population share: 22.1%
  • Most common country of origin: Mexico
  • Total foreign-born population: 492,617
  • Total population: 2,228,866

Photo Credit: ESB Professional / Shutterstock

8. Washington-Arlington-Alexandria, DC-VA-MD-WV

  • Foreign-born population share: 22.8%
  • Most common country of origin: El Salvador
  • Total foreign-born population: 1,425,904
  • Total population: 6,250,309

Photo Credit: Sean Pavone / Shutterstock

7. San Diego-Chula Vista-Carlsbad, CA

  • Foreign-born population share: 22.9%
  • Most common country of origin: Mexico
  • Total foreign-born population: 762,260
  • Total population: 3,323,970

Photo Credit: Tomas Simkus / Shutterstock

6. Houston-The Woodlands-Sugar Land, TX

  • Foreign-born population share: 23.3%
  • Most common country of origin: Mexico
  • Total foreign-born population: 1,623,239
  • Total population: 6,979,613

Photo Credit: Lukas Uher / Shutterstock

5. New York-Newark-Jersey City, NY-NJ-PA

  • Foreign-born population share: 29.3%
  • Most common country of origin: Dominican Republic
  • Total foreign-born population: 5,652,129
  • Total population: 19,261,570

Photo Credit: yhelfman / Shutterstock

4. San Francisco-Oakland-Berkeley, CA

  • Foreign-born population share: 30.7%
  • Most common country of origin: China
  • Total foreign-born population: 1,443,907
  • Total population: 4,709,220


RELATED

A reverse address lookup can tell you the first and last names of the people living at the address, their phone numbers, age, and even social media account information. For more information about how a reverse address lookup works, and for access to one, be sure to check out our reverse address lookup guide.


Photo Credit: Sean Pavone / Shutterstock

3. Los Angeles-Long Beach-Anaheim, CA

  • Foreign-born population share: 32.7%
  • Most common country of origin: Mexico
  • Total foreign-born population: 4,325,660
  • Total population: 13,211,027

Photo Credit: thetahoeguy / Shutterstock

2. San Jose-Sunnyvale-Santa Clara, CA

  • Foreign-born population share: 39.1%
  • Most common country of origin: China
  • Total foreign-born population: 775,944
  • Total population: 1,985,926

Photo Credit: Just dance / Shutterstock

1. Miami-Fort Lauderdale-Pompano Beach, FL

  • Foreign-born population share: 40.9%
  • Most common country of origin: Cuba
  • Total foreign-born population: 2,504,666
  • Total population: 6,129,858

Detailed Findings & Methodology

To determine the U.S. metropolitan areas with the largest immigrant populations, researchers at backgroundchecks.org analyzed the latest data from the U.S. Census Bureau’s 2020 American Community Survey. The researchers ranked metros according to the foreign-born population share. In the event of a tie, the metro with the higher number of immigrants was ranked higher. Researchers also calculated the most common country of origin, the total foreign-born population, and the total population.

To improve relevance, only metropolitan areas with at least 100,000 people were included in the analysis. Additionally, metro areas were grouped into the following cohorts based on population size: 

  • Small metros: 100,000–349,999
  • Midsize metros: 350,000–999,999
  • Large metros: more than 1,000,000

U.S. Counties With the Most Gun Deaths

Photo Credit: Prath / Shutterstock

Over the past few years, the U.S. has seen sharply increasing levels of violent crime. After two decades of decreases beginning in the mid-1990s, incidents have begun to rise again. Within the last two years, the trend has become especially pronounced. FBI data recently showed a 5.6% increase in violent crime from 2019 to 2020, even as rates of property crime continued to decline. In the same year, the murder rate rose by around 30%, one of the largest year-over-year increases on record.

Guns are closely tied to this trend in the U.S. The U.S. has the highest rate of civilian gun ownership of any country, and researchers have found the prevalence of guns to be associated with greater amounts of violent crime and gun deaths generally. Given these dynamics, it is unsurprising to see that gun-related deaths have spiked in recent years during the broader increase in violent crime.

Recent data from the CDC reveals how this trend has played out. In 2014, there were only 3.5 gun-related homicides per 100,000 population. By 2016, that figure increased to 4.6, and in 2020, it jumped to 6.2. Separately, gun-related suicides have also increased in recent years—from a low of 5.5 per 100,000 population in 2006 to 7.0 in 2020—but this increase has been more gradual.


RELATED

Public records and free information are the bedrock of democracy. Learn all that public records encompass—such as arrest and sex offender information, property records, and licensing info—and how to access this info for free or for cheap in our public records search tool and guide.


In total, 45,221 deaths in 2020 were gun-related, which is a 14% increase over the prior year and a 43% increase over a decade before. These gun-related deaths constitute a majority of both homicides and suicides. Over the past three years, more than three in four U.S. homicides (76.4%) involved a gun, while more than half of suicides (51.2%) were gun-related.

While the overall growth of gun-related deaths is a nationwide issue, some locations are more affected than others. Many of the states with the highest rates of gun-related deaths are states that also have the highest rates of gun ownership. These states include locations in the South and Mountain West, along with Alaska. Mississippi leads the nation in gun-related fatalities per 100,000 residents at 28.6, followed by neighboring Louisiana at 26.3 and Wyoming at 25.9. At the other end of the spectrum, Hawaii has the lowest rate of gun-related fatalities at 3.4 per 100,000 residents, followed by a group of Northeastern states including Massachusetts (3.7) and New Jersey (5.0). However, gun ownership is not a perfect predictor of gun deaths: for example, states like New Hampshire and Maine have relatively high levels of gun prevalence, but are also in the bottom 10 states for gun deaths per capita.

Gun-related deaths are also unevenly distributed at the local level. While some of the Southern and Western states with higher levels of gun fatalities do have counties with similarly high levels of gun deaths, many of the top counties are found in Rust Belt locations like Philadelphia, Indianapolis, and Detroit. These more economically distressed locations may have greater levels of gun violence due to the relationship between factors like social mobility and income inequality and gun deaths.

The data used in this analysis is from the CDC’s WONDER Database. To identify the locations with the most gun deaths, researchers at backgroundchecks.org calculated the rates of gun-related death per 100,000 residents in 2020. In the event of a tie, the location with the greater total number of gun-related deaths in 2020 was ranked higher. To provide additional context, researchers also calculated the proportion of all homicides and suicides that involve a gun, using data from 2018–2020.

Here are the counties with the most gun deaths.

Large Counties With the Highest Rates of Gun Deaths

Photo Credit: Christopher May / Shutterstock

15. DeKalb County, GA

  • Total gun-related deaths per 100k: 19.0
  • Total gun-related deaths: 145
  • Change in gun-related deaths since 2019: -15.2%
  • Gun-related homicides as a share of total homicides: 87.1%
  • Gun-related suicides as a share of total suicides: 57.3%

TRENDING

Are you tired of getting called by phone numbers you don’t know? Find out who’s behind any phone number using our reverse phone lookup tool.


Photo Credit: Rudy Balasko / Shutterstock

14. Hamilton County, OH

  • Total gun-related deaths per 100k: 19.4
  • Total gun-related deaths: 159
  • Change in gun-related deaths since 2019: +23.3%
  • Gun-related homicides as a share of total homicides: 85.9%
  • Gun-related suicides as a share of total suicides: 51.6%

Photo Credit: RCole3 / Shutterstock

13. Pima County, AZ

  • Total gun-related deaths per 100k: 19.5
  • Total gun-related deaths: 207
  • Change in gun-related deaths since 2019: +1.5%
  • Gun-related homicides as a share of total homicides: 69.4%
  • Gun-related suicides as a share of total suicides: 60.7%

Photo Credit: Jonathan Siegel / Shutterstock

12. Cook County, IL

  • Total gun-related deaths per 100k: 20.4
  • Total gun-related deaths: 1,040
  • Change in gun-related deaths since 2019: +45.7%
  • Gun-related homicides as a share of total homicides: 87.2%
  • Gun-related suicides as a share of total suicides: 33.5%

Photo Credit: Luciano Mortula - LGM / Shutterstock

11. Fulton County, GA

  • Total gun-related deaths per 100k: 21.4
  • Total gun-related deaths: 231
  • Change in gun-related deaths since 2019: +29.1%
  • Gun-related homicides as a share of total homicides: 83.1%
  • Gun-related suicides as a share of total suicides: 51.1%

Photo Credit: Nick Fox / Shutterstock

10. Oklahoma County, OK

  • Total gun-related deaths per 100k: 23.1
  • Total gun-related deaths: 186
  • Change in gun-related deaths since 2019: +0.5%
  • Gun-related homicides as a share of total homicides: 79.0%
  • Gun-related suicides as a share of total suicides: 58.2%

Photo Credit: The American Wanderer / Shutterstock

9. Cuyahoga County, OH

  • Total gun-related deaths per 100k: 24.3
  • Total gun-related deaths: 298
  • Change in gun-related deaths since 2019: +29.6%
  • Gun-related homicides as a share of total homicides: 82.1%
  • Gun-related suicides as a share of total suicides: 48.6%

Photo Credit: Paul Brady Photography / Shutterstock

8. Milwaukee County, WI

  • Total gun-related deaths per 100k: 25.6
  • Total gun-related deaths: 242
  • Change in gun-related deaths since 2019: +69.2%
  • Gun-related homicides as a share of total homicides: 82.3%
  • Gun-related suicides as a share of total suicides: 42.3%

Photo Credit: CHARLES MORRA / Shutterstock

7. Duval County, FL

  • Total gun-related deaths per 100k: 25.6
  • Total gun-related deaths: 247
  • Change in gun-related deaths since 2019: +14.4%
  • Gun-related homicides as a share of total homicides: 83.1%
  • Gun-related suicides as a share of total suicides: 56.6%

Photo Credit: Sergey Novikov / Shutterstock

6. Wayne County, MI

  • Total gun-related deaths per 100k: 26.3
  • Total gun-related deaths: 458
  • Change in gun-related deaths since 2019: +30.9%
  • Gun-related homicides as a share of total homicides: 86.2%
  • Gun-related suicides as a share of total suicides: 51.8%

Photo Credit: Rudy Balasko / Shutterstock

5. St. Louis County, MO

  • Total gun-related deaths per 100k: 26.4
  • Total gun-related deaths: 262
  • Change in gun-related deaths since 2019: +15.9%
  • Gun-related homicides as a share of total homicides: 90.8%
  • Gun-related suicides as a share of total suicides: 51.9%

Photo Credit: Jonny Trego / Shutterstock

4. Jefferson County, KY

  • Total gun-related deaths per 100k: 31.0
  • Total gun-related deaths: 238
  • Change in gun-related deaths since 2019: +65.3%
  • Gun-related homicides as a share of total homicides: 89.2%
  • Gun-related suicides as a share of total suicides: 53.0%

Photo Credit: Rudy Balasko / Shutterstock

3. Marion County, IN

  • Total gun-related deaths per 100k: 32.8
  • Total gun-related deaths: 317
  • Change in gun-related deaths since 2019: +46.1%
  • Gun-related homicides as a share of total homicides: 85.2%
  • Gun-related suicides as a share of total suicides: 58.0%

RELATED

If you’re trying to gather more information about a home you want to buy or a neighborhood you’re interested in buying in, consider using a reverse address lookup, which can provide names, criminal records, and property info from an address alone.


Photo Credit: Sean Pavone / Shutterstock

2. Philadelphia County, PA

  • Total gun-related deaths per 100k: 34.1
  • Total gun-related deaths: 538
  • Change in gun-related deaths since 2019: +46.6%
  • Gun-related homicides as a share of total homicides: 86.8%
  • Gun-related suicides as a share of total suicides: 38.1%

Photo Credit: The Speedy Butterfly / Shutterstock

1. Shelby County, TN

  • Total gun-related deaths per 100k: 40.6
  • Total gun-related deaths: 380
  • Change in gun-related deaths since 2019: +36.7%
  • Gun-related homicides as a share of total homicides: 91.5%
  • Gun-related suicides as a share of total suicides: 64.0%

Methodology & Detailed Findings

The data used in this analysis is from the CDC’s WONDER Database. To identify the locations with the most gun deaths, researchers calculated the rates of gun-related death per 100,000 residents in 2020. In the event of a tie, the location with the greater total number of gun-related deaths in 2020 was ranked higher. For national- and state-level statistics, the rates shown are age-adjusted. Age-adjusted rates are not available for county-level estimates. To provide additional context, researchers also calculated the proportion of all homicides and suicides that involve a gun, using data from 2018–2020. Only counties with at least 200,000 residents in 2020 were included in the analysis. Additionally, counties were grouped into the following cohorts based on population size: small (200,000–349,999); midsize (350,000–749,999); and large (750,000 or more).

Cities With the Most Residents Who Have “Side Hustles”

Photo Credit: Viktoriia Hnatiuk / Shutterstock

The term “side hustle” generally refers to a job on the side of a full-time job that brings in supplemental income for the worker. Side hustles often begin as a means to provide extra spending money or cover bills, but some eventually turn into full-fledged businesses. According to the latest data from the U.S. Census Bureau, nearly 3 million full-time workers (2.5% of total) had side hustles in 2019 and earned a median $6,800 annually from this extra work. These numbers are likely to increase amid the COVID-19 pandemic, alongside record numbers of new business applications.

Interestingly, certain privately conducted surveys show that up to a third or even as many as 45% of Americans perform work on the side. Census Bureau estimates are likely lower due to several factors pertaining to how side hustle work is defined and hesitancy among respondents to report side income on government forms. For one, the Census Bureau survey questionnaire asks respondents specifically about “self-employment income” from their “own businesses.” Less serious side hustlers or side hustlers who earn only a minimal amount of money may not view their efforts as actual businesses and thus might not report their side hustle earnings. In addition, workers may be hesitant to report under-the-table pay to a government agency for fear of being taxed. As such, the side hustle estimates calculated using Census data reflect those more legitimate business ventures that workers are willing to report to a government agency.

These factors perhaps contribute to the fact that higher-income workers are much more likely than low-wage workers to have side hustles, based on Census Bureau data. Over 5% of full-time workers earning over $100,000 per year have side hustles, twice the rate of workers earning $50,000–75,000, and more than six times the rate of workers earning less than $25,000. Having a side hustle is also correlated with educational attainment. Almost 4% of workers with a bachelor’s degree or higher have side hustles, compared with just 1.2% of high school graduates.

The prevalence of side hustler workers also varies by location across the U.S. Some of the Midwestern and Great Plains states have much larger shares of side hustlers than other parts of the country. At the state level, South Dakota (4.6%) and Nebraska (4.2%) have the largest percentage of workers with a side hustle. Workers in these two states tend to earn more from their side businesses as well, with median incomes of $7,500 and $8,000 respectively.


RELATED

Find out who’s behind any phone number, and learn exactly how reverse phone number lookups work, in our comprehensive reverse phone lookup guide. 


To determine the metropolitan areas with the most residents who have side hustles, researchers from backgroundchecks.org analyzed data from the U.S. Census Bureau. Metro areas were ranked by the percentage of workers with a side hustle, defined as full-time workers who have positive self-employment income that is less than their wage and salary income. Researchers also calculated the number of total workers with a side hustle, median total income for workers with a side hustle, median side hustle income, and median total income for all workers. Only the 100 largest metros in the U.S. were included in the analysis.

Here are the metros with the most residents with side hustles.

Metros With the Largest Share of Side Hustlers

Photo Credit: Sean Pavone / Shutterstock

15. Nashville-Davidson--Murfreesboro--Franklin, TN

  • Percentage of workers with a side hustle: 3.1%

  • Total workers with a side hustle: 25,630

  • Median total income for workers with a side hustle: $70,000

  • Median side hustle income: $6,000

  • Median total income for all workers: $47,700

Photo Credit: Michael Shake / Shutterstock

14. Toledo, OH

  • Percentage of workers with a side hustle: 3.2%

  • Total workers with a side hustle: 6,743

  • Median total income for workers with a side hustle: $66,300

  • Median side hustle income: $6,500

  • Median total income for all workers: $45,000


DID YOU KNOW?

A reverse address lookup is the act of finding information about the current residents, former residents, or property owner of a home or business using a specific street address. 


Photo Credit: Sean Pavone / Shutterstock

13. Boise City, ID

  • Percentage of workers with a side hustle: 3.2%

  • Total workers with a side hustle: 8,262

  • Median total income for workers with a side hustle: $65,000

  • Median side hustle income: $8,000

  • Median total income for all workers: $45,000

Photo Credit: f11photo / Shutterstock

12. Des Moines-West Des Moines, IA

  • Percentage of workers with a side hustle: 3.2%

  • Total workers with a side hustle: 9,359

  • Median total income for workers with a side hustle: $66,000

  • Median side hustle income: $6,400

  • Median total income for all workers: $53,000

Photo Credit: Henryk Sadura / Shutterstock

11. Grand Rapids-Wyoming, MI

  • Percentage of workers with a side hustle: 3.2%

  • Total workers with a side hustle: 10,800

  • Median total income for workers with a side hustle: $68,500

  • Median side hustle income: $5,500

  • Median total income for all workers: $48,000

Photo Credit: AMB-MD Photography / Shutterstock

10. Minneapolis-St. Paul-Bloomington, MN-WI

  • Percentage of workers with a side hustle: 3.2%

  • Total workers with a side hustle: 45,931

  • Median total income for workers with a side hustle: $76,000

  • Median side hustle income: $5,000

  • Median total income for all workers: $58,000

Photo Credit: Sean Pavone / Shutterstock

9. Portland-South Portland, ME

  • Percentage of workers with a side hustle: 3.3%

  • Total workers with a side hustle: 6,734

  • Median total income for workers with a side hustle: $77,220

  • Median side hustle income: $5,900

  • Median total income for all workers: $50,000

Photo Credit: Bob Pool / Shutterstock

8. Portland-Vancouver-Hillsboro, OR-WA

  • Percentage of workers with a side hustle: 3.3%

  • Total workers with a side hustle: 30,594

  • Median total income for workers with a side hustle: $85,000

  • Median side hustle income: $5,000

  • Median total income for all workers: $55,000

Photo Credit: Roschetzky Photography / Shutterstock

7. Austin-Round Rock, TX

  • Percentage of workers with a side hustle: 3.3%

  • Total workers with a side hustle: 30,970

  • Median total income for workers with a side hustle: $76,000

  • Median side hustle income: $5,000

  • Median total income for all workers: $51,000

Photo Credit: Roschetzky Photography / Shutterstock

6. Denver-Aurora-Lakewood, CO

  • Percentage of workers with a side hustle: 3.4%

  • Total workers with a side hustle: 42,915

  • Median total income for workers with a side hustle: $84,000

  • Median side hustle income: $6,000

  • Median total income for all workers: $59,000

Photo Credit: arburkholder / Shutterstock

5. Lancaster, PA

  • Percentage of workers with a side hustle: 3.6%

  • Total workers with a side hustle: 6,872

  • Median total income for workers with a side hustle: $52,000

  • Median side hustle income: $4,600

  • Median total income for all workers: $45,000

Photo Credit: photo.ua / Shutterstock

4. Salt Lake City, UT

  • Percentage of workers with a side hustle: 3.6%

  • Total workers with a side hustle: 17,598

  • Median total income for workers with a side hustle: $72,000

  • Median side hustle income: $5,000

  • Median total income for all workers: $49,500

Photo Credit: Sean Pavone / Shutterstock

3. Raleigh, NC

  • Percentage of workers with a side hustle: 3.6%

  • Total workers with a side hustle: 20,123

  • Median total income for workers with a side hustle: $72,000

  • Median side hustle income: $8,000

  • Median total income for all workers: $53,000


TRENDING

Learn what public records are and how to get access to most of the information for free or for a low cost in our detailed guide on understanding public records. Then use our public records search tool to find what you’re looking for.


Photo Credit: Wendell Guy / Shutterstock

2. Bridgeport-Stamford-Norwalk, CT

  • Percentage of workers with a side hustle: 3.9%

  • Total workers with a side hustle: 12,921

  • Median total income for workers with a side hustle: $90,000

  • Median side hustle income: $10,000

  • Median total income for all workers: $70,000

Photo Credit: Sean Pavone / Shutterstock

1. Provo-Orem, UT

  • Percentage of workers with a side hustle: 5.4%

  • Total workers with a side hustle: 9,908

  • Median total income for workers with a side hustle: $80,000

  • Median side hustle income: $9,000

  • Median total income for all workers: $50,000

Detailed Findings & Methodology

To determine the metropolitan areas with the most residents who have side hustles, researchers at BackgroundChecks analyzed data from the U.S. Census Bureau’s 2019 American Community Survey Public Use Microdata Sample. Metro areas were ranked by the percentage of workers with a side hustle. In the event of a tie, the metro with the larger number of total workers with a side hustle was ranked higher. Researchers also calculated median total income for workers with a side hustle, median side hustle income, and median total income for all workers. Workers with side hustles are defined as full-time workers who have positive self-employment income that is less than their wage and salary income. Only the 100 largest metros were included in the analysis.

1

45 Safest Colleges in Ohio for 2016

Ohio

The state of Ohio is located in the Midwestern United States. Border states include Michigan, Indiana, Kentucky, West Virginia, and Pennsylvania. The state is home to the Ohio River, and extensive natural landscapes made up of lakes, rivers, swamps, forests, and hilly terrain. Major metropolises are also located in the state, including Columbus, Cleveland, and Cincinnati. It’s estimated that more than 11.6 million people currently reside in the state of Ohio. Ohio industry prides itself on a green economy. Most businesses are related to the production of rubber, plastics, metals, and electrical equipment. The state is home to many top performing institutions of higher education, as well as some of the best public libraries in the country.

For the sake of this list, a “college” is considered any accredited public or private not-for-profit institution that offers four-year degree programs. Campus crime stats, graduation rates, and student retention rates were taken from U.S. Department of Education annual reports. Campus crime rates are based on the number of crimes per 1,000 residents.

Get the Badge!

Did Your City Make the List? Click here to get the badge and display it on your website!

#1 Cincinnati Christian University

640px-CCU_drive_and_campus_from_Glenway

The private Christian school of Cincinnati Christian University is situated in Cincinnati, Ohio. Campus is made up of facilities such as the George Mark Elliott Library, The Eagle’s Nest (Student Center), Hill Top Coffee Shop, the Worship and Ministry building, and residence halls. Most common areas of study include Communication Arts, Youth Ministry, Early Childhood Education, Urban & Intercultural Ministry, and Biblical Studies. The school is accredited by several organizations, including the Association of Theological Schools. Student athletes can participate in Division I sports belonging to the National Christian College Athletic Association.

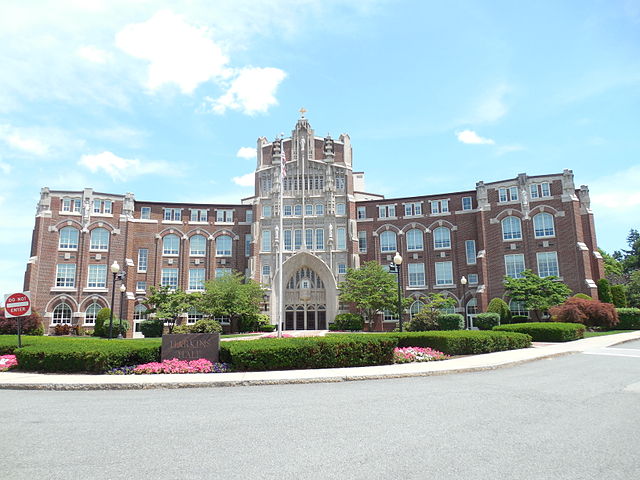
#2 Union Institute & University

UI&U_logo_square

Union University is a research institution situated in Cincinnati, Ohio. Students at the school can pursue degrees at the BA, MA, and PhD level. Academic programs are available to on-campus as well as off-campus students. The school is accredited by the Higher Learning Commission.  Additional campuses are located in Vermont, California, and Florida.

#3 Ohio State University – Lima

OSU_Lima_Logo

Ohio State University-Lima is set in Lima, Ohio and is more simply referred to as Ohio State Lima. A total of approximately 1,400 students attend the Lima campus, in addition to close to 60,000 students across the Ohio State University system. Students can choose from over 140 courses within 9 specific bachelor programs. Besides academics, students can also become involved in extracurricular activites such as athletics and over 20 other student organizations.

#4 Miami University – Hamilton

Hamilton, Ohio is home to Miami University Hamilton. Approximately 3,600 students attend the school each year. Students can pursue bachelor’s and associate degrees as well as a certificate program at the school. Miami University Hamilton is part of the larger Miami University system, with campuses in Oxford, West Chester, and Middletown, Ohio, as well as in Luxembourg. The university is a non-residential campus, although students can become involved in athletics such as softball, basketball, golf, and volleyball.

#5 Cleveland Institute of Art

GundBldg

The Cleveland Institute of Art in University Circle, Cleveland is among the oldest art and design colleges in the country. Approximately 570 students attend the school each year. Common areas of study include animation, printmaking, jewelry + metals, game design, illustration, and painting among many others. In addition to the bachelor of fine arts program, continuing education, summer workshops, and pre-college programs are also available to students.

#6 Mount Vernon Nazarene University

MVNUAthletics

The private liberal arts college of Mount Vernon Nazarene University is set in Mount Vernon, Ohio. More than 2,200 undergraduates and graduate students attend the school each year. Bachelor’s as well as Master’s programs are available to students. In addition to main campus at Mount Vernon, satellite campuses are located in Albany, Newark, and Mansfield as well. Students can become involved in such extracurricular activities as student government, mission trips, intramural sports, as well as NAIA athletics including basketball, baseball, cross country, golf, and soccer.

#7 University of Findlay

640px-University_of_Findlay_Science_and_Bell

Findlay, Ohio is home to the University of Findlay, a private university of about 3,700 undergraduate and graduate students. Undergraduate students can choose from more than 65 academic concentrations. UF specializes in unique programs such as pre-veterinary medicine, nuclear medicine technology, and equestrian studies. Campus spans 73 acres, including its extensive nature preserve and farmland which hosts facilities such as the James L. Child Jr. Equestrian Complex and Animal Sciences Center. In addition to academics, students can participate in over 100 student clubs and organizations.

#8 Malone University

640px-The_entrance_to_Mitchell_Hall

Malone University welcomes approximately 2,600 students annually to its Canton, Ohio campus. The school has maintained historically established religious affiliations, such as with the Religious Society of Friends and the Evangelical Friends Church International. Nevertheless, the student body is representative of almost 50 different religious sects. Students can study within the School of Nursing and Health Sciences, the School of Business and Leadership, the School of Education and Human Development, and the College of Theology, Arts and Sciences. Student organizations include Multicultural Student Union, Student Senate, and Forensics.

#9 Marietta College

640px-MC1794

The liberal arts school of Marietta College is situated in Marietta, Ohio. The total student body is comprised of approximately 1,200 students pursuing degrees in over 45 concentrations. Marietta College is dedicated to providing students with a liberal arts education, but also focuses on such core values as a global perspective, leadership, and community service. High achieving students are rewarded with such honors as the Dean’s List, Freshman and Sophomore Scholars, and Degrees with Distinction. Student athletes can participate in a total of 18 varsity sports.

#10 Lourdes University

Print

Sylvania, Ohio is home to Lourdes University, a Roman Catholic University that spans 127 acres. Postgraduates and undergraduates makes up a total of more than 1,500 students. Academics are based on a liberal arts curriculum as well as professional programs. Master academics include programs such as business and leadership, human services, and nursing. Besides academic pursuits, students are ingrained with core values based on service, community, reverence, and learning.

#11 Ohio Christian University

640px-OCU11

The private institution of Ohio Christian University is located in Circleville, Ohio. Each year, about 3,300 student attend the school to pursue degrees as Bachelor of Arts, Associate of Arts and Masters of Arts. In recent years, OCU has expanded its student center and science and logistic center. Students can join activities outside the classroom, such as athletic and student worship groups.

#12 John Carroll University

640px-MainBldgFullView

Jesuit Catholic institution, John Carroll University, is a private liberal arts school located in University Heights, Ohio. Approximately 3,000 undergraduate and 700 graduate students attend the university each year. Common undergraduates studies include business, science, and arts. All students must complete coursework in philosophy, religious studies, social justice, global studies, and a foreign language inline with Jesuit teachings of educating the individual as a whole. Students are also encouraged to participate in international programs in places such as England and Japan.

#13 Walsh University

Walshlogo

Located in North Canton, Ohio, Walsh University is a four-year institution with Roman Catholic affiliation. Approximately 3,000 undergraduates and graduates attend the school each year. Students choose from over 50 academic majors with an emphasis on liberal arts. Walsh University also specializes in a physical therapy program, among other rigorous graduate programs. In addition to academic pursuits at the main campus, students can attend classes at satellite campuses within Ohio, an international campuses including Castel Gandolfo in Italy.

#14 Bluffton University

Bluffton-logo

Bluffton University is a Christian institution that focuses on a liberal arts education. Over 1,000 students attend the school each year. Degrees include bachelor of arts, bachelor of science, master of arts in education, master of business administration, and master of arts in organizational management. In addition to academic achievement, Bluffton places an emphasis on social engagement and civic responsibility. Students can become active in athletics, student media, student government, as well as performance groups and spiritual organizations.

#15 Mount St. Joseph University

640px-Mount_Saint_Joseph

The private school of Mount St.Joseph University is situated on a suburban campus of 92 acres. Over 2,300 students attend the Catholic, co-educational school including undergraduates and graduates. Popular graduate programs include education, business administration, religious studies, nursing, and physical therapy. In addition to academics, students can become involved in the student newspaper as well as other extracurriculars.

#16 Lake Erie College

LECStorm

The liberal arts school of Lake Erie College is set in Painesville, Ohio. Each year, about 1,250 students attend the college. As early as 1954, and as the first to do so, Lake Erie College has encouraged students to continue their studies abroad. Lake Erie is well-known as a top school for equestrian studies. In addition to academics, students can become involved in NCAA Division II athletics.

#17 Miami University – Middletown

Miami University Middletown offers programs within bachelor’s and associate degrees as well as certificate programs. A total of about 3,000 students attend the school, as undergraduates and graduates. Campus spans a heavily forested area, and is considered the oldest regional campus in the Miami University system. Sports teams at the university function within the Ohio Regional Campus Conference

#18 Otterbein University

Otterbein_University_logo


Westerville, Ohio is home to Otterbein University, a liberal arts college. A total of nearly 3,000 students pursue studies in over 74 majors and 44 minors, as well as 8 graduate programs. Popular programs include education, music, engineering, and business management. In addition to academics, students participates in more than 100 student organizations including Greek Life and Ohio Athletic Conference athletics.

#19 Ohio Northern University

640px-ONU_McIntosh_Center

Ohio Northern University in Ada, Ohio hosts more than 3,700 students each year. ONU is comprised of five colleges, including the Claude W.Pettit College of Law. In addition to traditional academic programs, coursework is also available in a distant learning setting. Campus includes facilities like the Music Department building, Robertson-Evans Pharmacy building, and the Dial-Roberson Stadium. Students athletes can participate in NCAA sports, including baseball, basketball, cross country, soccer, and track & field.

#20 Ashland University

Ashland_University_logo

Spanning 135-acres, Ashland University is situated in Ashland, Ohio in addition to satellite campuses in north and central portions of the state. A total of approximately 5,700 students attend the university. Undergraduates alone can choose from about 70 majors. Popular areas of academic studies include environmental science, entrepreneurship, and actuarial science. Students can also pursue a range of education-related majors, incluign pre-K through doctorate related material. Ashland equips students with core values based on global citizenship and service, in addition to academic pursuits.

#21 Case Western Reserve University

640px-Case_western_reserve_campus_2005

Case Western Reserve University of Cleveland, Ohio welcomes 4,600 undergraduates and 5,600 graduates each year. Students hail from all 50 states and over 100 other countries. Popular academic programs include biology, social work, nursing, biomedical engineering, mechanical engineering, and psychology. Many alumni have gone on to work for notable software development companies and also include the lead developer and creator of Gmail. Prototypes for such inventions as cronoary artery disease surgery treatment, CPR defibrillation, blood transfusion, and polymers were all first developed at Case Western Reserve University.

#22 Cleveland State University

640px-CSU_Science_and_Research_Center

Cleveland State University, or CSU, is located in Cleveland, Ohio. Students total over 17,500 and pursue studies in the arts, sciences, and humanities, as well as research and creative endeavors. The school offers 70 majors in additions to 27 master’s programs and 6 doctoral degrees. CSU is known for its partnership with the NASA Glenn Research Center. In recent years, CSU has expanded on campus facilities, particularly in the technology and theater departments. Students are encouraged to get involved via student media and athletics.

#23 Baldwin Wallace University

640px-BW_south_campus_historic_district_sign

Berea, Ohio hosts the liberal arts college known at Baldwin Wallace University. Over 4,000 students attend the coeducational school as undergraduate and graduate students. Common academic programs at the school include neuroscience, business, education, and music. In particular, the institution is well-regarded for the Baldwin Wallace Conservatory of Music, which hosts a Bach Festival each year. Students athletes can participate in NCAA sports held at top-notch athletic facilities on campus.

#24 Xavier University

XavierUniversitySmithHall

The Jesuit Catholic school of Xavier University is situated in Norwood, Ohio, just outside Cincinnati. Each year, about 6,650 students attend the university as undergraduates and graduates. Academics are focused on the liberal arts, but as a Jesuit institution, there is also a strong emphasis on education of the whole individual. Highlights on campus include the Gallagher Student Center and the Bellarmine Chapel in addition to the Cintas Center, which hosts many athletic events. A total of 81 majors are offered at Xavier, including theology, history, literature, social sciences, and mathematics.

#25 Kent State University

640px-KentAkron

More than 30,00o students attend Kent State University of Kent, Ohio as undergraduates and graduates. Since 1910, Kent State has built a name for itself especially in the field of education. Today, over 300 programs are offered to students at the undergraduates, graduate, and doctoral level. Doctorate academics focus on programs such as library science, history, journalism, fashion design, nursing, and business. Campus covers nearly 870 acres and encompasses over 100 buildings as well as natural reserve areas. Kent hosts a number of satellite campuses as well including Ashtabula, East Liverpool, Salem, and Stark. Students can become involved in extracurricular activities such as Greek Life , performing arts, and student media. Athletes at the school participate in NCAA Division I athletics.

#26  University of Cincinnati

640px-University_of_Cincinnati_Solar_Decathlon_2007

The University of Cincinnati, or UC, enrolls more than 40,000 students each year at the undergraduate and graduate level. It’s considered among the 50 biggest universities in the country. UC, also a public research institution, has consistently ranked high for its academic programs on a national and international scale. UC also ranks high in the number of CEO alumni of Fortune 500 companies. Students can choose from over 350 programs including associate, bachelor, professional, and doctorate programs including music and arts, science and engineering, medical and human services, and business programs. Students can participate in international studies, co-op abroad, and research opportunities in addition to athletics and over 550 other student organizations.

#27 Muskingum University

600px-MontgomeryHall

New Concord, Ohio is home to Muskingum University. The Presbyterian affiliated institution welcomes about 2,600 undergraduates and graduates each year. Students choose from a total of 40 academic majors and several graduate programs. Campus spans 225 acres including a hilly landscape with over 20 residential, academic, and extracurricular buildings such as the Little Theater, Brown Chapel, Boyd Science Center, and the Neptune Center. Students can become involved in activities such as Greek Life and athletics.

#28 Youngstown State University

640px-JonesHall

Each year, approximately 15,000 students attend Youngstown State University as undergraduate and graduate students. While some students choose to live on campus, many others commute to classes every day from home or from off-campus housing. In addition to students hailing from around the country, the student body also represents international students from approximately 45 other countries. The school hosts a top notch planetarium, as well as academic and extracurricular facilities.

#29 Oberlin College

640px-Oberlin_College_-_Lewis_Center (1)

Officially established in 1833, and originally as the Oberlin Collegiate Institute, the Oberlin College of today is considered one of the oldest coeducational institutions of higher learning in the world. The school of 2,900 students is especially regarded for its Conservatory of Music. Students pursue academic interests in over 50 majors and minors. Popular studies include biology, history, politics, and environmental studies. The Oberlin student body is well-known for its commitment to political engagement, LGBTQ activism, student leadership and creative expression through the arts.

#30 Ohio University

640px-Ohio_University_Gateway

The public research institution, Ohio University, is set on 1,850 acres near Athens, Ohio. A total of approximately 38,000 students attend the university each year at the undergraduate and graduate level. Besides the main campus, additional campuses are located in Lancaster, Dublin, and Pickerington, Ohio to name a few. Students can choose from over 250 areas of concentration within the areas of business, arts and sciences, communication, engineering, fine arts, and technology. Students can join athletics, student media, and service organizations on campus as well.

#31 Urbana University

640px-Bailey_and_Barclay_Halls,_Urbana_University

The private liberal arts school known as Urbana University is set one hour from Columbus, Ohio in the city of Urbana. Over 1,500 students attend the institution each year. Undergraduate students are offered 28 major concentrations, while common graduate programs such as business administration and education are also offered. Students have many opportunities to become active on campus, including pep band, student government, history clubs, and NCAA Division II sports.

#32 Miami University

Miamiu

The University of Miami, also referred to as the U of M or The U, welcomes nearly 17,000 students each year as undergraduates and graduates. U of M is home to a law school, as well as research facilities and academic buildings built around atmospheric sciences and oceanography (Rosentiel School of Marine and Atmospheric Science). Students can choose from 116 bachelor’s programs, 105 master’s programs, and 63 doctoral degrees. In addition to all 50 of the United States, students also hail from more than 150 countries. The school is dedicated to sustainability on campus. Students can get involved not only in NCAA Division I athletics, but also in Greek Life, the student yearbook, the student newspaper, and several honor societies.

#33 University of Rio Grande

640px-Unvrio_logo

Rio Grande, Ohio is home to the University of Rio Grande, former Rio Grande College. Approximately 2,300 students come to the university each year to pursue such programs as education, fine arts, and nursing. Special facilities like the Greer Museum encourage students to experience art and culture outside the classroom. Rio Grande University is home to a Sculpture Garden as well as the Grande Chorale jazz group. Student athletes can participate in NAIA sports, including men’s soccer, baseball, and basketball, and women’s cross country, softball, and track & field.

#34 University of Dayton 

Overall of campus looking east, St. Mary's Hall, Chapel, St. Joseph Hall

A Roman Catholic school, the University of Dayton is a coeducational institution as well as research facility. Approximately 11,000 students attend the university as undergraduates and graduates. Students hail from across the country and around the world, including representation of 40 nations. Students choose from over 80 academic concentrations, including education, health sciences, arts, and engineering, as well as the first program in human rights in the country. Students can become involved in a myriad of activities on the historic campus including ministry, volunteering, and athletics, and are also encouraged to further their education abroad.

#35 Shawnee State University

OLYMPUS DIGITAL CAMERA

Situated in southern Ohio, Shawnee State University is a public school open to both undergraduate and graduate students. In total, about 4,600 students attend Shawnee each year. Students choose from over 80 bachelor’s, associate degrees, and master’s degree programs. Just some of many degrees offered include English and Humanities, psychology, education, computer programming, health management, photography, graphic design, plastics engineering technology, physical therapy, and simulation and gaming engineering technology. In addition to life on campus, students are encouraged to spend time abroad, including programs in Britain, Spain, Greece, and Ireland.

#36 Bowling Green State University

Panhel-photo

Over 17,500 students attend Bowling Green State University in Toledo, Ohio each year. The research university offers 200 undergraduate programs in addition to master’s and doctoral pursuits as well. Common research studies executed on campus include sociology, human development, energy, and sustainability. A satellite campus is located in Huron, Ohio (BGSU Firelands). In addition to academics, students can choose from over 300 students organizations to become involved in. Athletes compete at the NCAA Division I level as a member of the Mid-American Conference and the Western Collegiate Hockey Association.

#37 University of Toledo

640px-University_Hall_UToledo

The University of Toledo, or UT has three campuses, including its main campus in Toledo, and satellite campuses in Scott Park, West Toledo, downtown Toledo, and Maumee Bay State Park. Over 23,000 students attend the school each year. UT, since 2009, has committed to sustainability on its campuses by reducing food waster, recycling, and conserving water. Students can choose from more than 250 academic programs, within such colleges as the College of Communication, College of Engineering, College of Social Justice and Human Services, and the College of Natural Sciences and Mathematics. Students can become involved in athletics, research opportunities, study abroad, and service learning.

#38 University of Mount Union

640px-Mount_Union_Stadium

A private liberal arts school, the University of Mount Union is set in Alliance, Ohio. Each year, the school admits upwards of 2,200 students to its academic programs. The university has consistently ranked high as a leading liberal arts college of the Midwest. Students choose from over 60 majors and 53 minors of concentration. In addition, special areas of study are offered such as programs in pre-ministry, pre-law, and Army ROTC. Student athletes can participate in NCAA sports in a total of 11 men’s and 10 women’s sports. Students can also become involved on campus through Greek Life, theater, and music.

#39 University of Akron

675px-JohnBuchtel

Public research institution, the University of Akron, is situated in Akron, Ohio. More than 26,000 students attend the school as undergraduates and graduates. Academically speaking, undergraduates can choose from over 200 majors, and graduates have over 100 options in academic programs. Students hail from all over the state, country, and 71 additional countries. The College of Polymer Science and Polymer Engineering and University of Akron School of Law have long been regarded for their rigorous academic programs. University of Akron also leads in science research, particularly in orthopedics and medicine.

#40 College of Wooster

COWkaukehall

Each year, approximately 2,000 students attend the College of Wooster in Wooster Ohio, northeast of Columbus. From an early undergraduate level, students are encouraged to pursue research endeavors through a mentorship program. Degrees available include a Bachelor of Arts, Bachelor of Music, and Bachelor of Music Education. Students are encourage to gain a global perspective through study abroad programs in over 60 countries, in addition to majors such as International Relations and Cultural Area Studies. Students can also become active in the performing arts, student-run media, and athletics.

#41 Defiance College

DefianceYellowJackets

Liberal arts college, Defiance College, admits approximately 1,000 students each year. The school places a particular emphasis on social engagement in addition to academic excellence. Undergraduates can choose from over 40 majors, whereas graduates choose between a focus in either education or business. Popular programs include forensic science, nursing, and international studies. Defiance athletes participate in over 15 sports teams belonging to the NCAA and Heartland Collegiate Athletic Conference.

#42 Notre Dame College

640px-Main_Building_at_the_University_of_Notre_Dame

The liberal arts school of Notre Dame College is set in South Euclid, Ohio. About 2,250 students attend the school annually. The 48-acre academic campus offers students a choice of more than 30 majors. Students hail from all over the United States, as well as 19 foreign countries. Academic programs are broken down into art & humanities, business administration, education, nursing, science & mathematics. Other than academics, students can also become involved in honor societies and athletics.

#43 Wright State University

WRIGHT_STATE_UNIVERSITY_CREATIVE_ARTS_CENTER_LOBBY_FINAL_2_SMALL.

Situated in Fairborn, near Dayton Ohio, Wright State University is a public research institution open to men and women. Over 18,000 students attend the school each year. Much of present-day campus sits on portions of the former Wright-Patterson Air Force Base. A second satellite campus, spanning 173 acres, is located in Celina, Ohio, on the edge of Grande Lake St. Mary’s. Students can study within colleges such as Nursing and Health, Education and Human Services, Liberal Arts, and Science and Mathematics. Outside the classroom, students can become involved in Greek Life, ROTC, and athletics at the NCAA Division I level.

#44 Wittenberg University

640px-Wittenberg_Ward_St_En_11-23-08

Springfield, Ohio hosts Wittenberg University, a four-year, liberal arts school. Each year, approximately 2,000 students attend the school as undergraduates and graduates. Students choose from over 70 majors and special concentrations. Wittenberg University has consistently high as a top liberal arts college in the nation. Students are encouraged to become involved in their local community, as well as international affairs. The East Asian Institute for International Studies at Wittenberg University provides students with a study abroad opportunity that also promotes service learning. Extracurricular include Gay-Straight Alliance, student-run media, Pep band, Union Board, among many others.

#45 Ohio Wesleyan University

Stuyvesant Hall

Delaware, Ohio is home to Ohio Wesleyan University, a private liberal arts school. Nearly 1,650 students attend the school each year. Students hail from all over the United States, and in addition, Ohio Wesleyan has among the most international students at a liberal arts school in the country. Students pursue degrees as a Bachelor of Arts, Bachelor of Fine Arts, or Bachelor of Music. Nearly 90 majors are offered by the university. Both historically and up until the present day, Ohio Wesleyan places a strong emphasis on international learning and cultural immersion, with notable programs in Salamanca, Spain and Tanzania, Africa.

Share the “Safest Colleges” Badge on Your Site


8 Safest Colleges in Rhode Island for 2016

Rhode Island

The state of Rhode Island is located in the northeastern United States. It is the smallest state in the country (1,214 square miles), yet the eighth smallest in population. The “Ocean State” is not only bordered by the Atlantic Ocean, but by the states of Connecticuit and Massachusetts. Rhode Island is rich in history, as one of the original Thirteen Colonies, and the first to renounce British rule. Today, Rhode Island is home not only to cities like Providence, Warwick, Coventry, and Newport, but to expansive landscapes and natural points of interest, like the Ninigret Pond National Wildlife Refuge, Rhode Island Sound, Herimoth Hill, and Narragansett Bay. The highest paid elementary school teachers reside in the state. The state is home to many institutions of higher education, as well as local festivals, cultural events, and seaside tourism.

For the sake of this list, a “college” is considered any accredited public or private not-for-profit institution that offers four-year degree programs. Campus crime stats, graduation rates, and student retention rates were taken from U.S. Department of Education annual reports. Campus crime rates are based on the number of crimes per 1,000 residents.

Get the Badge!

Did Your City Make the List? Click here to get the badge and display it on your website!

#1 Salve Regina University

640px-Wakehurst1

The Catholic, coeducational school of Salve Regina University is set in Newport, Rhode Island. Campus spans 80 acres, and includes such historic buildings as the Ochre Court, McAuley hall, and Our Lady of mercy Chapel. Undergradutes and graduates make up a total student body of more than 2,700 students. Students hail from most of the United States, as well as 20 additional countries. The school offers a wide range of academic studies; among the most notable is the university’s nursing program. Student athletes participate in NCAA sports, including 10 varsity women’s sports.

#2 Rhode Island College

600px-Nazarian_center

Rhode Island College is a coeducational institution situated in Providence, Rhode Island. Each year, the school admits about 9,000 undergraduate and graduate students. Students pursue academic interests within the schools of education and human development, social work, nursing, management, and arts and sciences. More than 90 majors are offered to undergraduate students and 30 programs offered to graduate students. Outside the classroom, students can become involved in student government, radio, biology club, film society, and Christian Fellowship.

#3 Rhode Island School of Design

640px-RISD_Memorial_Hall

The Rhode Island School of Design, RISD, is located in Providence and specializes in fine arts and design. Over 2,000 students attend the school each year. Students come not only from all over the country, but from 57 foreign countries as well. Undergraduate students choose from 16 majors, and graduates choose from 17. Common concentrations include film, graphic design, interior architectures, photography, painting, and textiles. RISD has consistenyl ranked high as a top arts school within the country. Campus includes the RISD Museum as well as the Fleet Library and Nature Lab.

#4 Bryant University

Blackoutcourtshot (2)

Every year, more than 3,600 students attend Bryant University in Smithfield, Rhode Island to pursue degrees of bachelor of arts, bachelor of science, aw well as master’s degrees. Campus spans 428 acres and encompasses facilities such as the Fisher Student Center, George E. Bello Center for Information and Technology, and the Science, Industry, & Business Library. Bryant University is home to NCAA Division I athletics, Greek Life, and student-run media outlets.

#5 Brown University

640px-Brown_University_Sayles_Hall

Brown University, an Ivy League research facility and private institution of higher educations is located in Providence, Rhode Island. It is among the oldest universities in the United States, since its founding in 1764. Each year, over 9,000 students attend the university as undergraduates and graduates. Distinct programs are hosted by such colleges as the School of Public Health, School of Professional Studies, and Watson Institute for International and Public affairs. The university has produced numerous award recipients, including Nobel Prize winners, Pulitzer Prize winners, and National of Science laureates as well as notable political figures and member of congress and Cabinet officials. Students can join student organizations from a list of over 300, including student publications, immigrant rights groups, improv groups, and social activism.

#6 Johnson & Wales University

220px-Johnson_&_Wales_University_Logo.svg

Co-educational Johnson & Wales University is located in Providence, Rhode Island. Over 16,000 students are admitted each year. Common areas of study include education, engineering, culinary arts, business, hospitality, and sciences. Hotels on campus serve as a practicum facility for such disciplines as Food Service Management, Culinary Arts, and Hotel & Lodging Management. Outside of academics, students can become involved in Greek Life and athletics.

#7 Roger Williams University

640px-RWU_School_of_Engineering

Roger William University is a private liberal arts school situated in Bristol, Rhode Island. Campus spans 140 acres, and is home to over 5,000 students at the undergraduate and graduate level. Common majors include business, management, and marketing, architecture, and security, law enforcement, and protective services. A majority of students live on campus, and recent efforts have been made to increase campus sustainability. Student athletes can participate in NCAA Division II sports such as swimming & diving, soccer, softball, cross country, and lacrosse.

#8 Providence College 

640px-Harkins_Hall,_Providence_College,_Providence_RI

Providence College, more simply referred to as Providence, is a Roman Catholic institution with a total of nearly 5,000 students. Academics include 49 major offerings, and 34 minors. Most common majors are in business or liberal arts. Campus spans 105 acres, and includes buildings like the Patricia Ryan Center for Business Studies and Slavin Center. Students can choose to become involved in extracurriculars such as Greek Life, student radio, Providence College Debate Society (the oldest club on campus), and NCAA Division I athletics.

Share the “Safest Colleges” Badge on Your Site


1 2 3 11